New in CloudTables:
Nested data
We've rolled out the latest release of CloudTables today, and I'm really excited about the latest features:
- Display of nested link data
- Improved Excel import
Display of nested link data
Data in CloudTables is naturally well structured and hierarchal through its easy to use link ability - i.e. a row in a data set can refer to one or more rows in any other data set (or even itself). Since our day one launch it has been possible to display data from a linked data set in a table. Today we are introducing the ability to display data from a data set that the second data set links to. Indeed, it is not just possible to display data two levels deep now, but up to five links deep.
To demonstrate this ability, consider a table showing flight information - we might have a data structure of five tables:
- Flights
- Airline (link)
- Destination airport (link)
- Departure airport (link)
- Flight number (text)
- Airlines
- Name (text)
- Airports
- Name (text)
- Regions (link)
- Country (link)
- Regions
- Name (text)
- Countries
- Name (text)
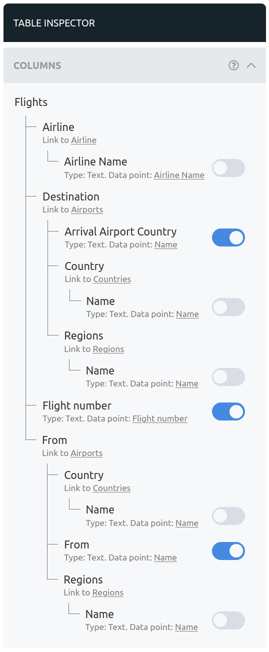
To be useful in a display, we need to be able to show information from all of these tables. The Table view for the Flights data set will now show a column selector like this:

Select the columns you wish to display to generate a table similar the following:
Note that this example is intentionally simplified for brevity! Additional details could of course be added such as departure and arrival times, additional information about airports, airlines and countries. You can easily modify the data in your CloudTables to suit your specific needs! Additionally, I've used a computed value to show the Airport code in the same column as its name to simplify the display.
Improved Excel import
You want to get your data into CloudTables as easily as possible, so we've been working on our our Excel import to better support:
- Formula results (note that the original formula is not imported, just the result)
- Hyperlink detection
- HTML detection
What's coming next
Support for boolean data points will be landing soon, following by a full CRUD REST API for adding, editing and deleting data from a data set, extending the read API we already have. Stay tuned for more updates!
